NIC PETROSSI (714) 272-3646

NIC PETROSSI (714) 272-3646
Yorba Linda, Brea, Fullerton, Placentia, Anaheim Hills, Orange, Anaheim, Tustin, Villa Park, Chino Hills

Placentia Homes for Sale and Yorba Linda Homes for Sale

Nic Petrossi is the #1 Realtor in Placentia, focusing much of his energy and time keeping up-to-date on Placentia homes and Placentia real estate, as well as selling Yorba Linda homes as an experienced Yorba Linda Realtor. Yorba Linda means "The Land of Gracious Living."

Search This Blog

Tuesday, October 27, 2009

Boo!!! - Is the End of 2009 Going to Be Scary???

This chart shows the US unemployment rate for the last 30 years. It is good to look at a larger span of history since a cursory glance at year-over-year since 2000 would be scary. But looking at the "bigger picture," we see that we're actually in a normal cyclical pattern of job loss and jobs gained. Interestingly, the peaks for unemployment were 1983, 1993 and 2003...ever 10 years, on the money. We see dips in the unemployment (job gains) in between those horrible peaks. Now in 2009, we're seeing a peak coming that is earlier than the normal 10 year pattern. So, comments are welcome as to why that may be and where you think we're headed from here. However, knowing that there are dips and valleys and peaks and mountains gives us more of a broader paint brush stroke over the whole of U.S. unemployment. In the days of FDR, the government stepped in and created jobs for Americans. It's hard to say if that will happen again or if it really needs to happen, but what the government is doing is trying to help Americans stay in their homes by keeping the interest rates low, imposing 3 month moratoriums for possible refi/loan mods. It's one thing to lose your job. It's another thing to lose your job and your home.


MOUNT EVEREST & DEATH VALLEY


The chart to your left shows U.S. Consumer Confidence over the last 30 years. As you can see, we are now in a sharp dip, the lowest in the last 30 years. The latest results from the Conference Board Consumer Index shows that consumer confidence for the month of October is down from August and September. This looks like bad news heading into the Christmas shopping season. However, the reading for October is just under 50. To give you an idea of what that means...at the beginning of 2008, the reading showed 87.9. In the first and second quarters of 2007, the reading was well over 100. The whole YEAR of 2006 saw readings over 100 points. March of 2003 showed the lowest reading in recent history with 61.4 points. The year 2000 was the peak of consumer confidence...and I mean Mount Everest! Every month in 2000 was over 128 points with highs of 144.7 in January and May of 2000. We are now back down to early 1990 levels. 1991 and 1992 showed very, very low levels of confidence taking a dramatic drop in the middle of 1990 and not really recovering until 1994. The Consumer Confidence Index is a huge factor when evaluating our present economical situation. If Americans aren't spending, businesses suffer. When businesses suffer, American lose jobs. It's just that simple. We are presently in a "Death Valley" of consumer confidence - which makes perfect sense. The unemployment rate is through the roof, several of the homes sampled for this data were those of unemployed people or people who had lost their jobs, especially since people who tend to respond to long surveys usually are those who have a ton of time on their hands, like maybe they don't have a job. Needless to say, people who don't have a job aren't going crazy this Christmas. The economy will continue to see a slump and until the blood-letting is slowed down, we won't see a shift in the overall U.S. economy for some time.
Is this a dismal outlook? Well, it's realistic, but I wouldn't say dismal. I believe that we'll see a slump that will last a few more years and then a rebound of consumer confidence that will hit the 90s and even into the 100 marks by 2012. We are seeing a wake up call for Americans. No more pulling equity out of your home to finance vacations and toys, no more pulling equity from a home that could possibly decrease in value in the future. No more getting buried in credit card debt to our shoulders. Americans will be more cautious in the future because many have learned their lesson the hard way. It's a bitter pill to swallow, but at least America will see a return to saving and conservatism financially. Maybe we'll see that 0.5% national rate for saved income go up to 5% or 10%. Maybe we'll see our country crawl and climb and scratch its way out of debt. Only time will tell.


Read more...

Wednesday, October 14, 2009

ORANGE COUNTY HOME PRICES ON THE RISE

DATAQUICK REPORTS FIRST YEAR-OVER-YEAR GAIN FOR O.C. SINCE 2007


According to the Los Angeles Times in an article in Business Section on Oct. 14,2009 Orange County home values have seen the first year-over-year gain since 2007. From $425,000 in September of 2008 to $429,000 in September of 2009. The article cites tax breaks, low interest rates, and pent-up demand as the factors creating a stabilization of home prices in Orange County. One economist said, that if prices DO fall again, it won't be more than 15% max.

Are the foreclosures going to continue to pull down home values?

Although Orange Countians will continue to go into default on their mortgages, the number of foreclosurs has declined DRAMATICALLY since the same month last year. ForeclosureRadar, an online source for NOD data, reports foreclosures are down 42% from the same month last year. The decrease in bank repos has led to a reduction in inventory, which has tipped the scales in favor of demand over supply. The inventory for homes, especially in the middle-to-upper price ranges has been steadily declining. Overall, there is just less out there for picky buyers to choose from. Several agents in my office at Prudential California Realty in Brea are reporting multiple offers (sometimes in excess of 20 offers) on properties in the lower price ranges (under $500K). What does this mean? A stabilization of the lower end market. History tells us that the stabilization will creep up into the middle ranges and eventually even the luxury homes.

Click on PLAY button below to see an example of a VIRTUAL TOUR, cutting edge real estate from NIC PETROSSI in an Internet Age.

Read more...

Tuesday, October 13, 2009

SELLING YOUR HOME WITH VIRTUAL TOURS & FLOOR PLANS

WELCOME TO THE FUTURE OF REAL ESTATE: VIRTUAL HOME TOURS

NIC PETROSSI (714) 272-3646

WHY ARE VIRTUAL TOURS AWESOME?

  1. Since it's as easy as a "click" to see the inside of your home, more Potential Buyers are inclined to see your home creating greater exposure.
  2. It's like an OPEN HOUSE, but online.
  3. It enables a niche of ultra-busy potential buyers the opportunity to view the selling features of your home without leaving the comfort of their own home.

According to the official Alta Vista South HOA website, Alta Vista South is comprised of 214 upscale single family homes. Among other things, the community website offers a calender of community events, information regarding the property management company (South Coast Property Management in Costa Mesa), and the CC&R’s, By-Laws, and other legal documents available for download.

The Alta Vista South Homeowner’s Association is made up of 5 tracts of homes: HQT, Bel Maison, William Lyon Homes, Biscayne, and Highpoint. Below is a list of each tract with general spec’s for each floor plan. Actual floor plans are available upon request by contacting Nic Petrossi at (714) 272-3646 or email npetrossi@yahoo.com

NIC PETROSSI, Prudential California Realty (714) 272-3646

Bel Maison

  • Plan One 4 Beds 3 Baths 2,698 SF 2 Car Garage
  • Plan Two 5 Beds 3 Baths 2,628 SF 3 Car Garage
  • Plan Three 5 Beds 4 Baths 2,901 SF 3 Car Garage
  • Plan Four 5 Beds 3 Baths 3,192 SF 3 Car Garage

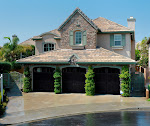
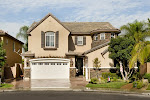
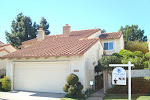
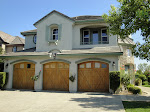
Bel Maison architecture is unique in that the builder Saddleback Pacific Homes, incorporated French Chateau elements. Passers-by will often refer to these homes as the “Castle Homes” due several of the homes having a castle-like cylindrical turret and stone edifice.

Streets in Bel Maison are: Underhill, Dickinson, Brady, Lowe, Newman, Hunt, and Olson. (Named after Placentia City Council members around the time of construction).

Lyon Homes

  • Residence One 4 Beds 3 Baths 2,533 SF 3 Car Garage
  • Residence One (1) 4 Beds 3 Baths 2,613 SF 2 Car Garage
  • Residence One (2) 4 Beds 3 Baths 2,693 SF 2 Car Garage
  • Residence Two 4 Beds 3 Baths 2,775 SF 3 Car Garage
  • Residence Two (alt) 4 Beds 3 Baths 2,949 SF 2 Car Garage
  • Residence Three 5 Beds 3 Baths 3,002 SF 3 Car Garage
  • Residence Three (1) 6 Beds 3 Baths 3,200 SF 3 Car Garage
  • Residence Three (2) 6 Beds 3 Baths 3,354 SF 2 Car Garage

Summarily, the difference in square footage between a Residence Two and a Residence Two (alt) for example, is due to either the absence or presence of a 3 Car Tandem garage. The area used for the 3rd car is optional and if the home does NOT have the tandem, it will have more square footage.

Streets in Lyon Homes: Torrey Pines, Quail Run, Augusta, and Spyglass.

HQT Homes

  • Residence One 3 Beds 2.5 Baths 3,233 SF 3 Car Garage
  • Residence One (alt) 4 Beds 2.5 Baths 2,408 SF 2 Car Garage
  • Residence Two 4 Beds 3 Baths 2,266 SF 3 Car Garage
  • Residence Two (alt) 4 Beds 3 Baths 2,366 SF 2 Car Garage
  • Residence Three 5 Beds 3 Baths 2,448 SF 3 Car Garage

Streets for HQT Homes: Bay Hill, Pebble Beach, Doral, and Firestone.

HighPoint

  • Plan One 4 Beds 3.5 Baths 2,693 SF 3 Car Garage
  • Plan One (alt) 5 Beds 4.0 Baths 2,851 SF 2 Car Garage
  • Plan Two 4 Beds 4.0 Baths 2,917 SF 3 Car Garage
  • Plan Two (alt) 5 Beds 4.0 Baths 3,087 SF 2 Car Garage
  • Plan Three 4 Beds 3.0 Baths 3,081 SF 3 Car Garage
  • Plan Three (alt) 5 Beds 3.0 Baths 3,201 SF 3 Car Garage

Streets for HighPoint: Maertzweiler, Black, Melia, Little, Soto

Biscayne

Unfortunately, the floor plans are not available at this time for the Biscayne models. Streets are Cline, Faley, Thomann, Atchley, Robertson, Snow, Kemp, Black, and Maertzweiler. (Parts of Black and Maertzweiler shared with HighPoint).

Read more...

Alta Vista South Placentia: Schools and Boundary Maps

The following are the elementary, junior high, and high schools for the Alta Vista South neighborhood homes. School boundary maps can be found at my WEBSITE through the “School Boundaries” link, or click here —–> Placentia Yorba Linda School Boundaries.

Elementary: Tynes

Junior High: Kraemer (Kraemer is technically a “Middle School” with Grades 6 through 8)

High School: Valencia

Tynes API score is 7; raw score is 805 out a possible 1000, which means the school performed better than at leat 70% of other elementary schools statewide. For a detailed Academic Accountablity Report for Tynes, click here —–> REPORT Although this blog was posted August 31, 2009, the latest scores available are from 2007. School performance may have increased or decreased since 2007.

Kraemer API score is a 6; raw score is 749 out a possible 1000, meaning the school performed better than at least 60% of other elementary schools statewide. For a detailed Academic Accountability Report for Kraemer, click here —> REPORT Results of this report are from 2007. School academic performance may have increased or decreased since then.

Valencia API score is 758 out a possible 1000. Valencia’s school accountability report is very difficult to find on the school website. However, the school is not hiding anything: it is one of the top high schools in Orange County with its highly acclaimed International Baccalaureate Program, VAL-Tech Program for rigorous technology training, and Honor Society. Valencia High School has an energetic, enthusiastic teaching staff, committed to promoting excellence and student achievement. (Having a daughter of my own attending Valencia, I am impressed by the pride and commitment to excellence embodied in its staff).

Looking to sell YOUR home??? Call NIC PETROSSI at (714) 272-3646 or email: npetrossi@yahoo.com

Read more...

Saturday, October 3, 2009

CALIFORNIA SEEN AS HOTTEST HOME MARKET IN 2010…

This was the headline in a small Orange County Register article, penned by Jonathan Lansner on July 28th. The source of the claim is FiServ, who are responsible for the Case-Shiller home price indexes. They are forecasting home prices rising 5.7% in 2010. Remember, this comes after home prices falling 48.5% from 2006. (According to OC Register and their source is Dataquick). In fact, the May index posted its first rise in home price nationally since the summer of 2006 and this index is comprised of a 20-city index. What can we get from all of this? Well, guarded optimism is a safe bet. The index measures price data in only 20 metropolitan areas, but that would seem more than enough for a thumbnail sketch of where the market is going. According to the Register News Service, these numbers matter because, “Investors closely watch the Case-Shiller to gauge the level and direction of home prices.” According to Maureen Maitland, Vice President of S&P’s index services, “We may be on the way to recovery…It will take a couple more months to see if we have turned around.” The bottom line is we appear to be on our way. Would be investors, first time buyers, and move up buyers may well be advised to start looking for that property they want. Interest rates remain very attractive, but are sure to go up in the future. Why? Remember the bailout? There is the likely possibility that as we start paying for that, inflation will rise eventually, and that means interest rates will rise. No one knows exactly when. But there is another good reason to get out there and look.

Read more...

About This Blog

This Blog is designed to keep you up-to-date with relevant information regarding home buying and home selling in Placentia and Yorba Linda. Your one-stop source for home values, floor plans, community HOAs, PYLUSD High School Boundary Map, API Scores for Placentia-Yorba Linda Schools and more.

About Me

My photo
Placentia, CA, United States
Husband of 1, Dad of 5, Realtor of Everyone

  © Blogger templates Psi by Ourblogtemplates.com 2008

Back to TOP